▌ Reports · Michigan · September 2026
Detroit's three casinos + Michigan online + retail sports, September 2026: $459,300,909, +14.35% YoY
Detroit's three casinos + online + retail sports; MGCB prints no all-gaming total and tribal casinos do not report
By vertical
Michigan gaming revenue by vertical, September 2026 and September 2025
| Vertical | September 2026 | September 2025 | YoY |
|---|
| Detroit casinos | $102,775,642 | $98,181,263 | +4.68% |
|---|
| Retail sports | $784,762 | $775,903 | +1.14% |
|---|
| iGaming | $300,233,148 | $259,123,961 | +15.86% |
|---|
| Online sports | $55,507,358 | $43,585,798 | +27.35% |
|---|
As printed by MGCB
| Vertical and printed lines | September 2026 | Tie Δ | September 2025 | Tie Δ |
|---|
| Detroit casinosDetroit casinos, total adjusted gross receipts | $102,775,641.88 | 0.00 | $98,181,263.16 | 0.00 |
|---|
| Retail sportsDetroit retail sports betting, total gross receipts | $784,762.23 | 0.00 | $775,902.98 | 0.00 |
|---|
| iGamingInternet gaming, total gross receipts | $300,233,147.72 | 0.00 | $259,123,961.32 | 0.00 |
|---|
| Online sportsInternet sports betting, total gross sports betting receipts | $55,507,357.64 | 0.00 | $43,585,798.47 | 0.00 |
|---|
How this ties to MGCB's printed figures
MGCB printed lines against GGR Data
| MGCB document | Verticals | Month | Printed | GGR Data | Δ | Tolerance | Tie |
|---|
| MGCB land_casino_2026-XLS.xls | Detroit casinos | September 2026 | $102,775,641.88Detroit casinos, total adjusted gross receipts | $102,775,641.88 | 0.00 | +0.01 | pass |
|---|
| MGCB land_casino_2026-XLS.xls | Detroit casinos | September 2025 | $98,181,263.16Detroit casinos, total adjusted gross receipts | $98,181,263.16 | 0.00 | +0.01 | pass |
|---|
| MGCB osb_2026-XLS.xls | Retail sports | September 2026 | $784,762.23Detroit retail sports betting, total gross receipts | $784,762.23 | 0.00 | +0.01 | pass |
|---|
| MGCB osb_2026-XLS.xls | Retail sports | September 2025 | $775,902.98Detroit retail sports betting, total gross receipts | $775,902.98 | 0.00 | +0.01 | pass |
|---|
| MGCB igaming-2026.xlsx | iGaming | September 2026 | $300,233,147.72Internet gaming, total gross receipts | $300,233,147.72 | 0.00 | +0.01 | pass |
|---|
| MGCB igaming-2026.xlsx | iGaming | September 2025 | $259,123,961.32Internet gaming, total gross receipts | $259,123,961.32 | 0.00 | +0.01 | pass |
|---|
| MGCB osb-2026.xlsx | Online sports | September 2026 | $55,507,357.64Internet sports betting, total gross sports betting receipts | $55,507,357.64 | 0.00 | +0.01 | pass |
|---|
| MGCB osb-2026.xlsx | Online sports | September 2025 | $43,585,798.47Internet sports betting, total gross sports betting receipts | $43,585,798.47 | 0.00 | +0.01 | pass |
|---|
Like-for-like
- Retail sports: +1.14% all-store, +0.08% same-store (excludes Greektown Casino, MGM Grand Detroit)
Rank
- September 2026 ranks 7th of 69 months since January 2021
- September 2026 ranks 1st of 6 Septembers since 2021
By property
Michigan revenue by property, September 2026 and September 2025
| Property | September 2026 | September 2025 | YoY |
|---|
| MGM Grand Detroit | $48,837,911 | $45,865,559 | +6.48% |
|---|
| MotorCity Casino | $32,600,718 | $28,931,411 | +12.68% |
|---|
| Greektown Casino | $21,337,014 | $23,384,294 | -8.75% |
|---|
Monthly history
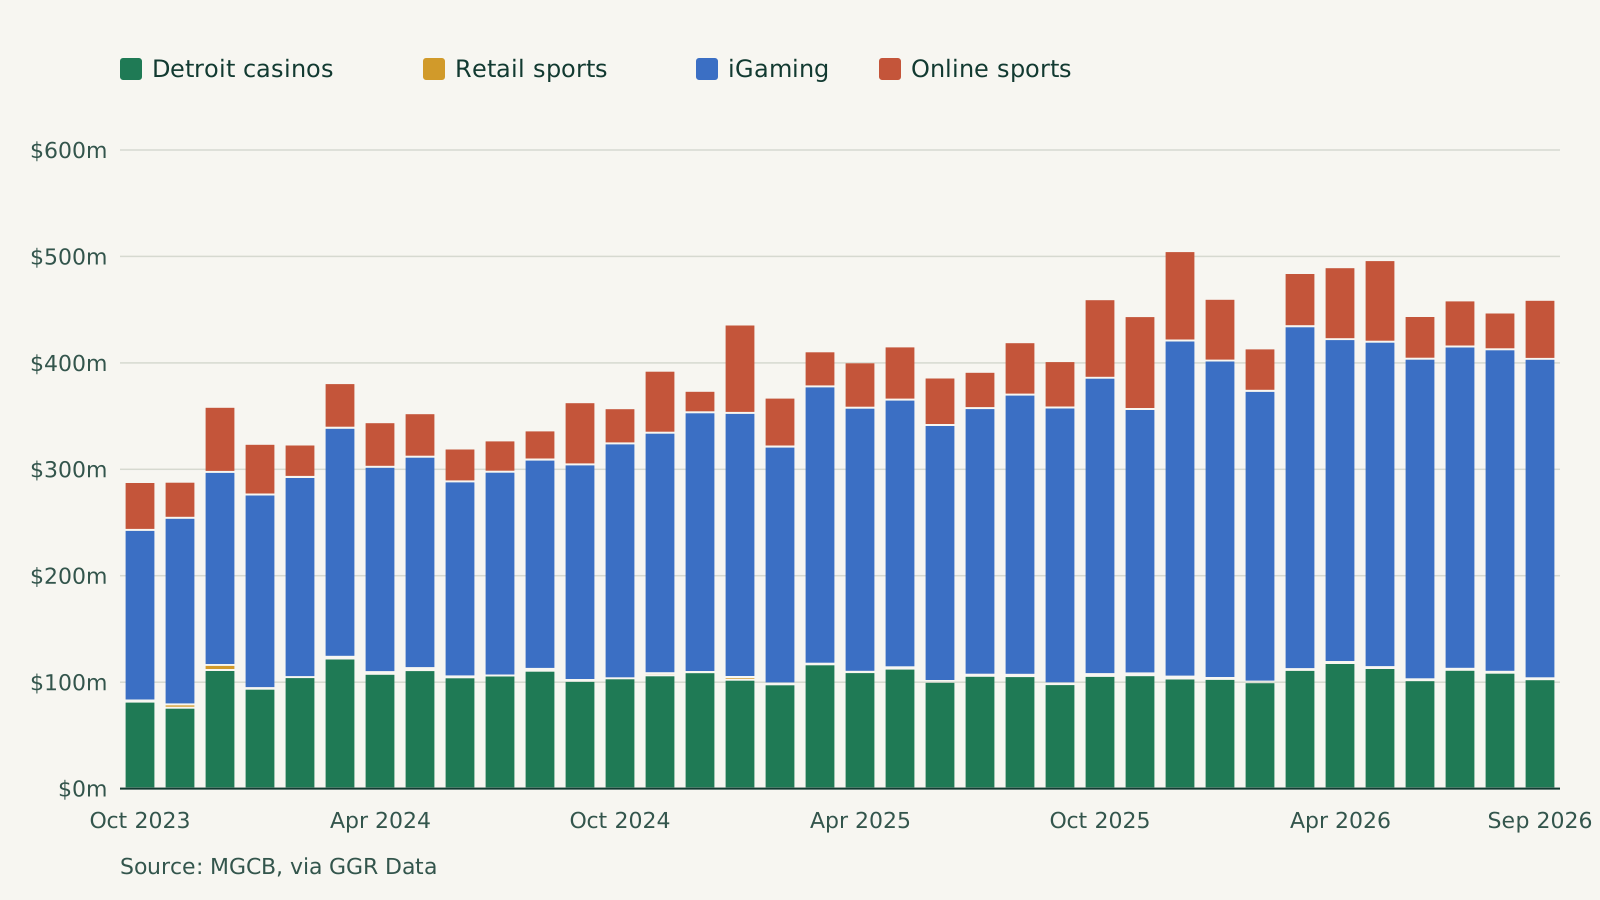
The chart’s months as a table
Michigan monthly gaming revenue by vertical, October 2023 to September 2026
| Month | Total | Detroit casinos | Retail sports | iGaming | Online sports |
|---|
| September 2026 | $459,300,909 | $102,775,642 | $784,762 | $300,233,148 | $55,507,358 |
|---|
| August 2026 | $447,340,915 | $108,862,041 | $876,492 | $303,016,076 | $34,586,307 |
|---|
| July 2026 | $458,713,116 | $111,643,618 | $939,620 | $302,774,279 | $43,355,599 |
|---|
| June 2026 | $444,030,989 | $101,845,102 | $837,681 | $301,226,271 | $40,121,935 |
|---|
| May 2026 | $496,574,089 | $113,311,160 | $799,787 | $305,763,639 | $76,699,503 |
|---|
| April 2026 | $489,926,163 | $118,032,112 | $868,546 | $303,399,067 | $67,626,438 |
|---|
| March 2026 | $484,414,713 | $111,516,955 | $826,098 | $322,050,683 | $50,020,977 |
|---|
| February 2026 | $413,550,708 | $100,001,848 | $578,285 | $273,108,546 | $39,862,028 |
|---|
| January 2026 | $460,224,098 | $103,086,893 | $789,669 | $298,311,148 | $58,036,388 |
|---|
| December 2025 | $505,000,763 | $103,400,764 | $1,759,195 | $315,818,699 | $84,022,105 |
|---|
| November 2025 | $443,960,350 | $106,503,676 | $1,728,647 | $248,427,578 | $87,300,450 |
|---|
| October 2025 | $459,833,765 | $105,931,003 | $1,562,833 | $278,528,666 | $73,811,263 |
|---|
| September 2025 | $401,666,926 | $98,181,263 | $775,903 | $259,123,961 | $43,585,798 |
|---|
| August 2025 | $419,459,771 | $105,676,108 | $1,247,790 | $263,270,693 | $49,265,180 |
|---|
| July 2025 | $391,600,163 | $105,975,725 | $1,040,713 | $250,507,750 | $34,075,976 |
|---|
| June 2025 | $386,236,061 | $100,379,545 | $666,374 | $240,566,554 | $44,623,588 |
|---|
| May 2025 | $415,449,697 | $112,730,957 | $1,287,954 | $251,473,593 | $49,957,192 |
|---|
| April 2025 | $400,517,576 | $109,447,648 | $336,021 | $248,110,938 | $42,622,970 |
|---|
| March 2025 | $410,855,124 | $116,784,353 | $580,011 | $260,520,946 | $32,969,814 |
|---|
| February 2025 | $367,352,493 | $98,013,728 | $820,450 | $222,527,253 | $45,991,062 |
|---|
| January 2025 | $436,010,980 | $102,299,593 | $2,526,133 | $248,150,753 | $83,034,501 |
|---|
| December 2024 | $373,791,485 | $109,319,460 | $279,649 | $243,985,944 | $20,206,434 |
|---|
| November 2024 | $392,644,339 | $106,441,300 | $1,928,292 | $225,995,786 | $58,278,960 |
|---|
| October 2024 | $356,559,166 | $103,673,981 | -$822,552 | $220,675,862 | $33,031,875 |
|---|
| September 2024 | $363,037,271 | $101,229,067 | $771,751 | $202,591,670 | $58,444,784 |
|---|
| August 2024 | $336,506,681 | $110,793,319 | $1,695,049 | $196,660,172 | $27,358,141 |
|---|
| July 2024 | $326,784,806 | $106,303,231 | -$379,047 | $191,439,942 | $29,420,680 |
|---|
| June 2024 | $319,561,737 | $104,554,380 | $894,867 | $183,204,915 | $30,907,575 |
|---|
| May 2024 | $352,705,546 | $111,341,364 | $1,868,502 | $198,597,831 | $40,897,849 |
|---|
| April 2024 | $344,244,606 | $107,872,951 | $1,573,562 | $192,934,494 | $41,863,598 |
|---|
| March 2024 | $380,950,951 | $122,262,266 | $1,605,262 | $215,153,827 | $41,929,596 |
|---|
| February 2024 | $323,153,491 | $104,759,798 | -$120,142 | $188,032,275 | $30,481,559 |
|---|
| January 2024 | $323,984,217 | $93,904,688 | $520,988 | $181,881,751 | $47,676,789 |
|---|
| December 2023 | $358,724,989 | $111,396,739 | $4,794,677 | $181,407,932 | $61,125,642 |
|---|
| November 2023 | $288,346,848 | $76,002,516 | $3,116,350 | $175,301,066 | $33,926,916 |
|---|
| October 2023 | $288,107,908 | $81,698,365 | $1,133,185 | $160,273,835 | $45,002,523 |
|---|
Sources and as-of
Published by Michigan Gaming Control Board; in GGR Data 2026-10-22 22:22 UTC; confirmed 2026-10-26 16:39 UTC
scripts.state_report 1.0.0 · data 2026-10-22 22:21:51 · sha256 2a07ef16973f