01Inputs — what you give the model
The four inputs
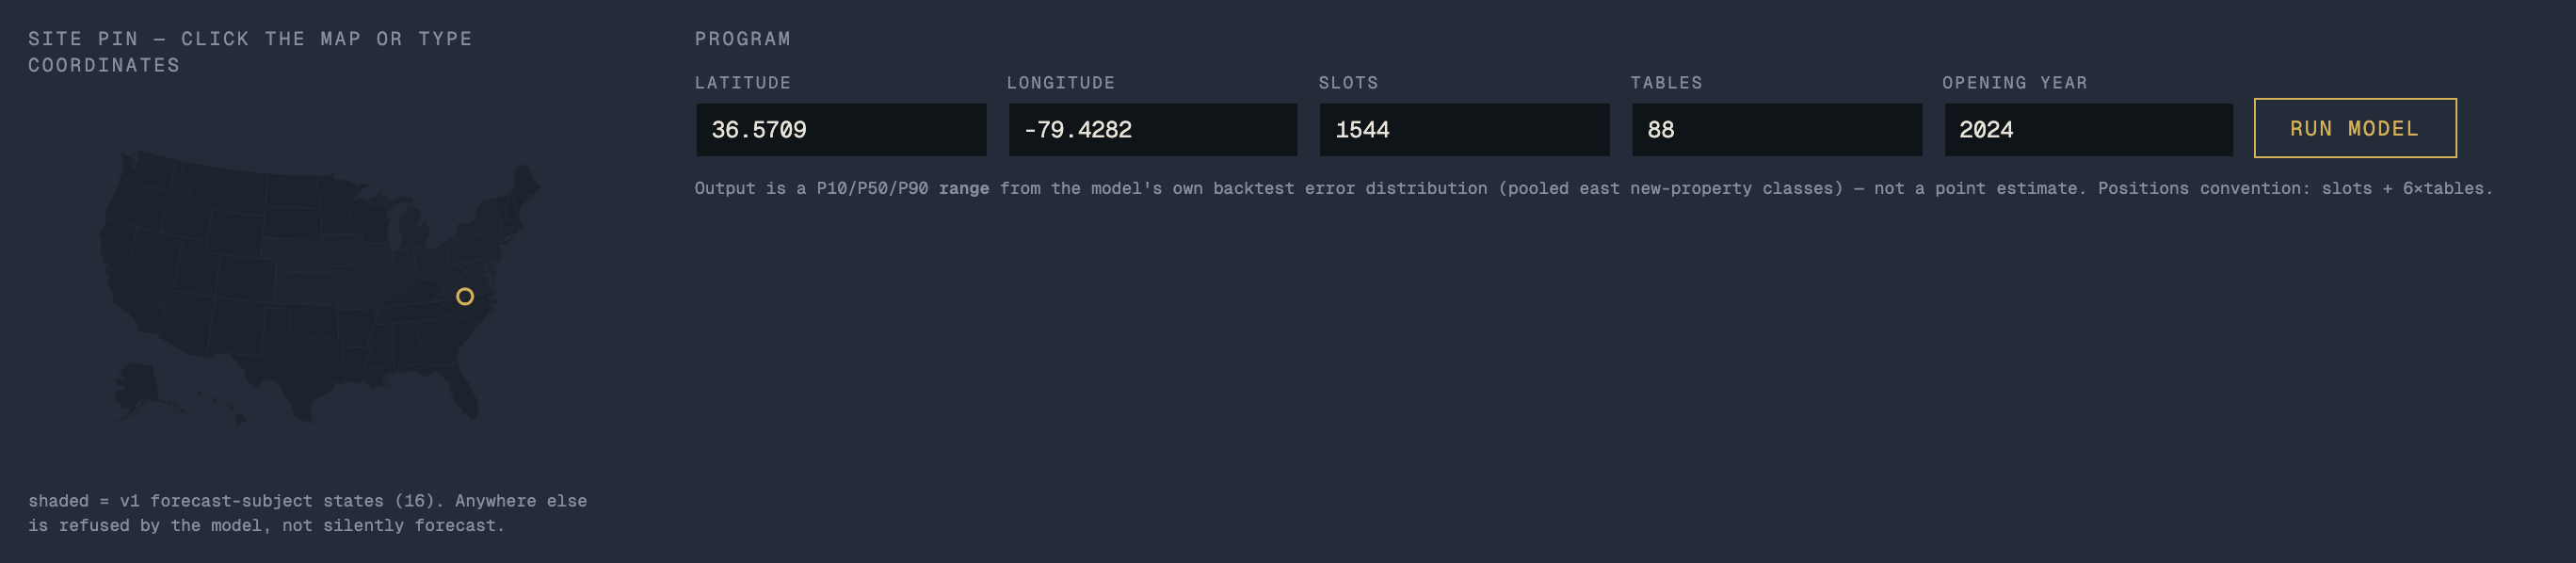
- The forecast takes four inputs. Nothing else about your project is required or used.
| Input | Form | Constraints |
|---|---|---|
| Site location | latitude / longitude pin | must fall in a covered subject state (17 calibrated states, plus California, Nevada, Arizona, Oregon, Colorado and Mississippi as a position-method class — two counts, never one summed number); Nevada is served as a locals market, so Las Vegas Strip pins are refused; the pin must snap to the road network within 5 km or the request is refused rather than guessed |
| Gaming scale | slot machines | 0–6,000 |
| table games | 0–600 (a table counts as 6 gaming positions by convention) | |
| Opening year | calendar year | 2024–2035 |
Existing sites
- Pinning an existing casino’s site is a supported case. If a roster property sits within 500 m of your pin, the model treats your program as its replacement. That property leaves the competitor set, and the response names it. Without this rule a forecast at an existing site would compete against itself.
Not asked for
- No construction budget, brand, amenity program or marketing plan. They matter to outcomes, but no model can price them honestly from a form field, and pretending otherwise is how feasibility studies manufacture precision.
- The revenue effect of the site-quality factors the inputs cannot carry is expressed in the output range (Section 03), which is built from how real forecasts of this type have actually missed.
- A new-build premium is applied automatically from the opening year.
Scope
- Scope. Regional and locals commercial markets, in the 17 states the model is calibrated on, plus California, Nevada, Arizona, Oregon, Colorado and Mississippi as a position-method class (Section 04) — served on labelled competitor supply rather than in-state actuals, and labelled that way in every response. The two counts are reported separately and are never added into one number: they are different claims about what stands behind a forecast. Destination resorts are out of scope, and that includes the Las Vegas Strip: a Strip pin is refused, while the Nevada locals markets around it are served. Markets outside those two lists are out of scope too: the API says so rather than returning a number.
02Analysis — what the model does with them
Structure
- A two-stage gravity (Huff-class) model, computed on census block groups — roughly 139,000 of them across the covered region
- Participation. Each block group’s adults (21+) generate gambling trips as a saturating function of the total gaming supply within realistic drive reach. More nearby supply means more trips, with diminishing returns. This is what lets the model split a new casino’s revenue into demand captured from existing casinos and demand that is new to the market.
- Allocation. Each block group’s trips divide across every competing casino in proportion to attraction over distance. Attraction is gaming positions raised to a fitted exponent, adjusted for floor space per position and building age. Distance is measured drive time, not mileage.
Drive times
- Self-hosted road network from OpenStreetMap (© OpenStreetMap contributors, ODbL), routed with the OSRM engine and our own calibrated speed profile.
- Validated against an independently published drive-time matrix: median ratio 0.99 across the 20 reference pairs.
- Known residual: urban-core congestion corridors run optimistic. Documented, not patched.
Demand layer
- American Community Survey 2019–2023 block-group demographics: adults 21+, median household income (which drives spend per visit through a fitted income elasticity), population-weighted centroids.
Calibration
- Fitted on a 12-year monthly panel of casino-level admissions and revenue from state regulators: roughly 1,300 stable property-months across 19 properties.
- Transfer-tested out of state afterwards (below).
- Spend per visit is a separately fitted layer (income, scale and time trend) on the same panel.
Disclosure policy.
- This specification discloses the model’s full structure. Fitted coefficient values are held at the calibration layer.
- Every served response carries the parameter hash (
params_hash), so any change to the fitted parameters is externally visible even though the values are not printed. - Deeper parameterization detail is available to customers and counterparties on request.
Sanity checks
- The pin must snap to real roads near the site. A wrong-road-network forecast fails loudly rather than pricing on the wrong state’s highways.
- Out-of-scope or out-of-universe requests return a clean refusal, not a degraded number.
- Every response carries the model version, parameter hash and routing host, so any forecast can be tied to the exact model state that produced it.
Blind spot
- A blind spot we measured and print. Route and distributed gaming (Illinois video gaming terminals, Pennsylvania skill games, Nevada taverns) is not in the competitor roster.
- We backcast all 15 permanent Illinois casinos to measure the consequence: the model over-calls every one, median 2.7× on the raw point (range 1.7–7.1×; 1.9× median after the published class adjustment).
- Pre-registered tests found that local VGT density does not explain which casinos miss worst. The absorption is statewide, not local.
- So we print the caveat rather than fit a correction the data cannot identify. Every response discloses it, and Illinois subject sites should be read as upper bounds.
Transfer tests
- The model is calibrated in one market and tested in others. The tests are pre-registered: criteria and thresholds are frozen in writing before any result is seen, and misses are recorded, never re-fitted after the fact.
- Cross-state transfer. Calibrated with zero eastern data, the model predicted the revenue impact of a major 2016 market entry on the nearest incumbent within 1.3 points of the actual outcome (−18.5% predicted vs −17.2% actual). It beat a naive machine-share benchmark by double digits on the two real cannibalization events in that market.
- Fresh out-of-sample, 2025. Backcast against three Virginia casinos’ CY2025 actuals, markets the model never fitted: all three errors landed inside the served range, and all three joined the reference class below.
- Adversarial backcast. On a 2024 head-on market entry the model got all three incumbent impact directions right and the magnitudes wrong: it over-predicted incumbent losses. That result was not softened. It ships inside the product as a disclosure (Section 03).
- Iteration discipline. Seven pre-registered improvement rounds have run since the model shipped. All seven were rejected under their own frozen criteria, and the serving model was left unchanged each time. One round’s written rationale contained a sign error; it is recorded in the verdict rather than edited away.
03Output — what you get and how to read it
Headline
- Lead with the range, not the point. The headline output is an annual gaming-revenue band.
P10 / P90
- What it is. The range. The model’s estimate with the empirical error distribution of 18 real forecast-vs-actual pairs of this class applied: 10 Pennsylvania 2006-era openings, 5 Rocky Gap loop years, 3 Virginia 2025 openings scored out-of-sample this August.
- How to read it. Real historical misses, not a statistical confidence interval: how forecasts like this have actually landed, not the model’s uncertainty about itself.
Model point
- What it is. The raw gravity estimate.
- How to read it. Sits around the 72nd percentile of the empirical distribution. Forecasts of this class have come in below their models more often than above.
Adjusted P50
- What it is. The model point multiplied by the reference class’s median actual-to-forecast ratio, currently about 0.715.
- How to read it. The number we would bet at even odds. It prints beside the model point, always.
Headline rule
- The criteria are pre-registered, not discretionary: a minimum pair count, independent studies, macro eras, and a bootstrap interval excluding zero. As of this update the interval criterion is newly met; the pair-count and study-count criteria are not, so the dual display stands.
Caveat
- Two of the three Virginia actuals are year one of permanent facilities, so those errors likely shrink as the properties mature.
The rest of the response
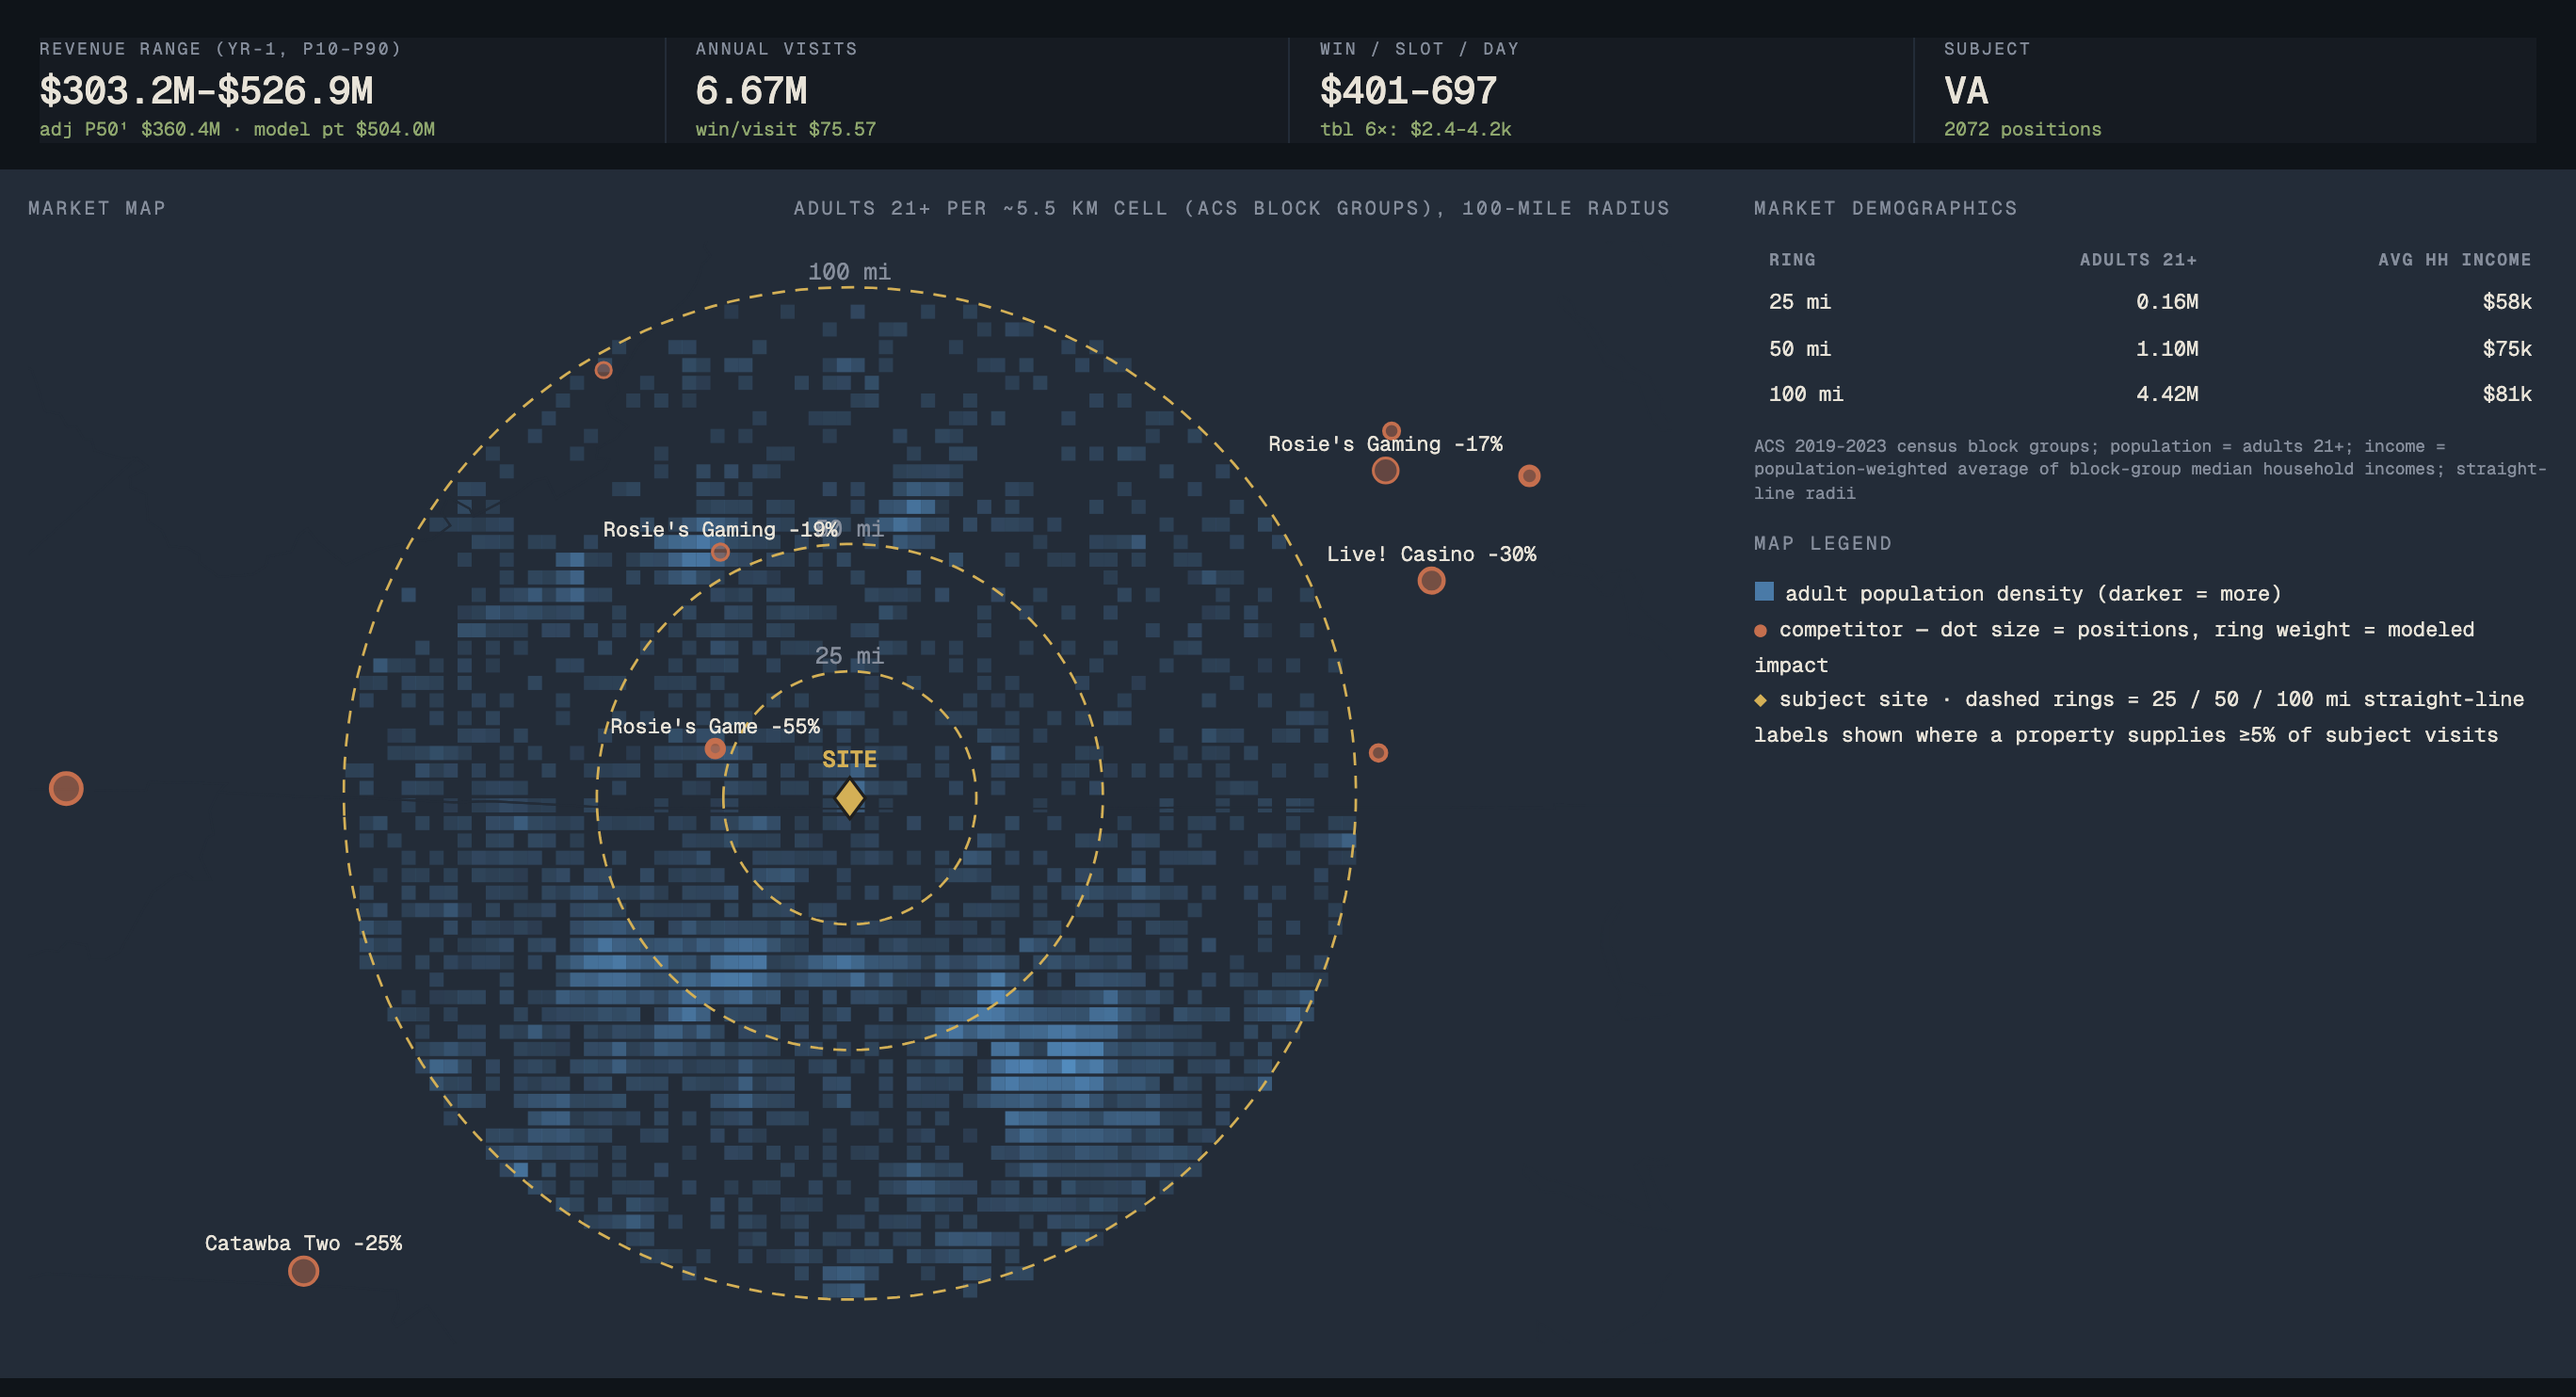
- Sources of business: captured-from-competitors vs new-to-market visits, and projected market growth — the split the participation term exists to answer.
- Cannibalization table. Per-competitor impact estimates, distance-ordered. Read these as upper bounds: in the one head-on entry we have scored, the model over-predicted incumbent losses by roughly 2.5–4×. This disclosure ships in the response itself, not in a footnote.
- Unit economics: win per visit, win per position/slot/table per day at P10/P50/P90, with the position convention stated.
- Demographics & market map: ring populations and incomes (25/50/100 mi), and an adult-density grid for the trade area.
- Audit trail: model version, parameter hash, graph host, data sources, and every convention used, in the response body.
What it is not
- What the output is not. Not a feasibility study, not investment advice, and not a destination-resort model. It is a calibrated, validated, honestly-banded market model with its known failure modes printed on the label.
04The position-method class
The six states
- Six states are served on labelled competitor supply instead of an in-state calibration. What they share is the thing that keeps them out of the calibrated set: none of them publishes gaming revenue at property grain, so there is nothing in-state to fit the model to or score it against. What they do not share is the quality of the supply behind them, so each response names its own source:
| State | Where the competitor counts come from | Floors | Positions |
|---|---|---|---|
| California | no regulator count exists — assembled per floor from operator sites, SEC filings, dated press, government documents and floor area, each row labelled with its rung (the ladder below) | 67 | 99,702 |
| Nevada | the Gaming Control Board’s own licensed-device census, Nonrestricted Count Report effective 30 June 2026 — every served floor exact | 142 | 140,801 |
| Arizona | the Department of Gaming’s per-facility census of operated devices, Status of Tribal Gaming in Arizona, 1 August 2025 — Class II and Class III both counted | 28 | 24,132 |
| Oregon | the Oregon Tribal Gaming Alliance impact report’s per-casino device table, plus dated press for floors opened since | 11 | 8,514 |
| Colorado | the Division of Gaming’s own per-licence device census, Statewide Casino Listing by City with Device Counts as of 31 July 2026 — every served floor exact; the 73 poker tables the Division lists separately are excluded, because poker is not banked | 33 | 11,686 |
| Mississippi | the Gaming Commission’s per-licence device census, Gaming Devices Report: Slots and Gaming Devices Report: Tables, July 2026 — every served floor exact; 53 poker tables and 2 keno tables excluded, and the 15 closed floors stay in the roster rather than being deleted | 25 | 23,736 |
- Read that table as a ranking. Nevada, Arizona, Oregon, Colorado and Mississippi rest on a regulator count; California does not, and cannot. Nevada’s counts are licensed devices, which run about 3% above the machines operators actually have on the floor. Oregon’s 10,521 lottery video-lottery terminals across 2,007 retailers are competing supply the model does not yet carry, so an Oregon forecast overstates how much a new floor would capture. Colorado and Mississippi are commercial, not tribal, and their reason for being here is narrower than California’s: both regulators publish a device census every month and publish revenue only by town (Black Hawk, Central City, Cripple Creek) and by region (Central, Coastal, Northern) — a real published market total, but never a property, so there is nothing to fit or score against.
Nevada is a locals market
- Las Vegas Strip pins are refused. The model allocates the gambling trips of people who live within a drive. The Strip’s customers overwhelmingly do not live within a drive — they arrive by air — so running the model there would not be slightly wrong, it would be measuring the wrong population. The API refuses a Strip pin and says why. Henderson, Summerlin, North Las Vegas and the Boulder Strip are served: those are locals markets, which is what this model is for.
- Every Nevada response carries a market check. Nevada publishes gaming win by area every month — not by property, which is why it is not a calibrated state, but it is still a real published total for the exact ground your pin is standing on. So each response reports the model’s own sum over that area beside the Control Board’s trailing-twelve-month win for it, and the ratio between them. Nothing in the forecast is scaled to that ratio, now or ever: the moment a coefficient moved to close it, the number above would stop being a transfer and start being an unbacktested in-state fit wearing a transfer’s label.
Why it is separate
- The 17 calibrated states of Section 01 are calibrated: the model was fitted, or admitted on transfer, against monthly property-level revenue that state regulators publish. These six are served on a different footing, and the response says so on every call.
- No in-state actuals exist to calibrate on. California Business and Professions Code §19821 and the tribal-state compacts keep tribal device counts and gaming revenue confidential — the State Auditor said so plainly in report 2016-036. Nevada’s Control Board reports win by area, never by licensee. Arizona and Oregon publish device counts but no floor-level win. Colorado publishes adjusted gross proceeds by town and Mississippi gross gaming revenue by region, and neither publishes a licensee. There is no equivalent of the Iowa or Maryland monthly file in any of the six, and no amount of work produces one.
What is served (California)
- A forecast run on parameters transferred from the Iowa fit with no refit, against a California competitor roster of 67 tribal floors carrying 99,702 gaming positions, each pinned at the regulator’s own map coordinates.
- The evidence that the model travels is the Maryland transfer test: applied to the Horseshoe Baltimore entry with zero Maryland refitting, it predicted −18.5% against −17.2% actual, with rank correlation 0.80 across the affected properties. That is the basis on which a transferred estimate is offered — not a California backtest, because none can exist.
What is not served
- No California revenue coverage. Nothing in this class adds a revenue series; our coverage disclosure still carries California casino revenue as out of scope, because it is.
- No in-state calibration and no California-scored band. The range comes from the same 18 commercial pairs as everywhere else, labelled in the response as a transfer basis.
- No per-property California estimates are published. The competitor floors exist to allocate demand inside the model; they are not a product.
The supply ladder (California)
- California only. Because no regulator publishes the counts there, every floor’s position count carries the rung it came from. The response prints the mix for the exact competitor set it used, so you can see how much of the market around your pin is measured and how much is inferred.
| Basis rung | What it means | Floors | Share of positions |
|---|---|---|---|
| Exact | a stated count from the operator, an SEC filing or a government document | 23 | 46.2% |
| Exact, stale | a stated count whose source is no longer current | 1 | 2.0% |
| Operator lower bound | “more than 2,000 slots” — a floor, never rounded up | 22 | 32.2% |
| Operator approximation | an operator’s own “about” figure | 3 | 9.0% |
| Square-footage derived | published gaming floor area ÷ 36 sq ft per position | 4 | 3.8% |
| Directory band | a third-party directory’s figure, the weakest rung | 14 | 6.8% |
- Read down the table: 48.2% of California’s gaming positions are stated counts, 89.3% are stated counts or the operators’ own bounds, and 6.8% rest on a directory. The 36 sq ft per position divisor is the median of the calibration panel’s own floors, not a rule of thumb.
- Each row also carries its source URL and date, and whether the count is Class III devices only or unstated.
The band is widened
- Labelled supply is a real source of error, so it goes inside the range rather than into a footnote. The model is re-run twice on the same choice set: once with every directory-band competitor dropped, and once with every operator lower bound raised to its ceiling (the compact cap where one is published, otherwise the floor plus 25%). The served P10–P90 is stretched to contain both re-runs, and both figures print in the response.
- The re-runs are arithmetic, not a second model: no new fitted parameter, and the same result every time for the same pin.
The published rails
- Every California response is checked against a figure that is public. The National Indian Gaming Commission reports FY2025 gross gaming revenue of $12,631,303,247 across 88 operations in its Sacramento Region — California plus one individually-owned facility in northern Nevada, so effectively the California tribal market.
- Divided by the roster’s 99,702 positions, that is about $347 of win per position per day statewide. The response prints your pin’s implied figure beside it and flags anything outside 0.5× to 2.0× of it. NIGC revenue may be earned up to 16 months before publication and pools tribes with different fiscal year-ends, so it is used as a sanity rail — never as a calibration.
- Nevada’s rail is tighter, because Nevada publishes more. The Control Board’s own trailing-twelve-month win for your pin’s area, divided by that same area’s roster positions, is a like-for-like figure: same ground, same floors, published monthly. It ranges from about $118 of win per position per day in the Carson Valley to $273 in the Clark County balance and $483 on the Strip. Your pin’s implied figure prints beside its own area’s, flagged outside 0.5× to 2.0×.
- Colorado’s and Mississippi’s rails work the way Nevada’s does. Colorado publishes adjusted gross proceeds by town and Mississippi publishes gross gaming revenue by region, so each pin is checked against its own town’s or region’s published trailing twelve months over that same area’s roster positions — same ground, same floors, published monthly, two-sided. The label follows the metric: Colorado’s number is adjusted gross proceeds, not gaming win, and the response says which it is rather than borrowing Nevada’s word for it.
- Arizona’s and Oregon’s rails are one-sided, and the response says so. The NIGC reports FY2025 revenue of $4,211,135,056 across 54 operations in its Phoenix Region and $4,943,983,904 across 58 in its Portland Region. Neither region is one state: Phoenix covers Arizona, Colorado, New Mexico and southern Nevada, and Portland covers Washington, Oregon, Idaho and Alaska. Dividing a four-jurisdiction total by one state’s positions therefore gives a number strictly above that region’s real win per position per day — a ceiling, not an average. It is served as a ceiling: a pin above it is flagged, and a pin below it has been told nothing. Applying California’s two-sided test there would flag every honest Arizona and Oregon forecast as impossibly low, which is a worse failure than having no rail at all.
How to read it
- A position-method estimate is an honest transfer, not a calibrated forecast, and it is labelled that way in the API response, in the interface, and here. If that distinction matters to your decision — and for a tribal market it usually does — the response gives you everything you need to discount it yourself.
05Data sources & licensing
Sources
- Every input in the serving path is open data or public record — there are no third-party licensed feeds, no data-vendor accounts, and nothing a customer's compliance team needs to clear on our behalf.
- Road network: OpenStreetMap (© OpenStreetMap contributors, ODbL 1.0), self-hosted; routing via OSRM (BSD-2-Clause) with our own calibrated speed profile. We serve routing results; the derived graph is not redistributed.
- Demographics: U.S. Census Bureau — ACS 2019–2023 block-group tables, 2020 population-weighted centroids, and TIGER geometries (public domain, bulk files).
- Calibration actuals: state gaming regulators' monthly property-level revenue and admissions publications (public records).
- Validation benchmarks: publicly filed feasibility and legislative studies, cited pair-by-pair in the validation record.
In the response
- Every API response repeats this in a data_sources block, so the provenance ships with the number.